Image Details

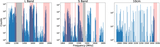
Caption: Figure 7.
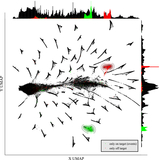
Mapping of individual observations of the entire candidates list onto an abstract UMAP space. In green we show a promising candidate, where all the “A” observations seem similar to each other, and different from the off-target “B” observations, which is reflected in a high similarity score, while the candidate in red shows no such clustering.
Other Images in This Article
Copyright and Terms & Conditions
© 2025. The Author(s). Published by the American Astronomical Society.
Copyright ©
2025 Astronomy Image Explorer. All Rights Reserved.