Image Details
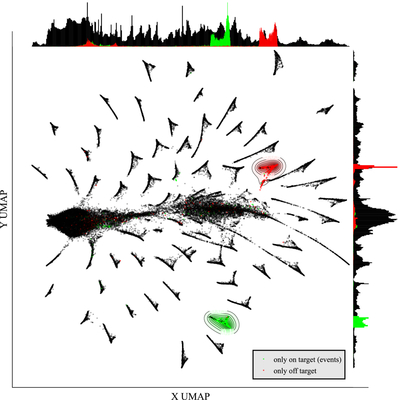
Caption: Figure 3.
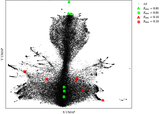
Mapping of simulated signals onto an abstract UMAP space. Every point is a simulated signal from our validation data set in any or all of the six windows of a cadence. In green we mark the signals that are only on-target, while in red we show those that exclusively off target for comparison. All the other clusters in black are various on-off combinations. In light green (red) we delineate the probability derived from the exclusively on(off)-target categories of the training set. In the margins we show the marginal distribution of the validation set. In addition to the well-defined clusters, one can see a large group near the left of the plane. Visual inspection shows that this is where undetected weak signals, i.e., background noise, cluster.
Other Images in This Article
Copyright and Terms & Conditions
© 2025. The Author(s). Published by the American Astronomical Society.