Image Details
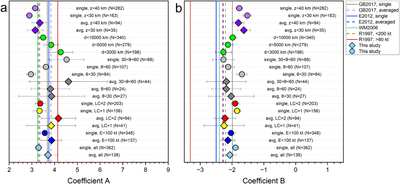
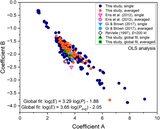
Caption: Figure 11.
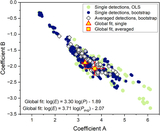
Coefficients A (a) and B (b) from ﹩\mathrm{log}\left(E\right)=A\mathrm{log}\left(P\right)+B﹩, plotted for numerous bolide subgroups. Each point represents a distinct partition (e.g., by altitude, angle, distance, or fragmentation type), with error bars indicating fit uncertainties. Reference lines from N. Gi & P. Brown (2017), T. A. Ens et al. (2012), R. Whitaker & J. Mutschlecner (2006), R. W. Whitaker (2023), and D. O. Revelle (1997) are shown for comparison, demonstrating how geometry (e.g., shallow vs. steep angles) and multifragmentation (LC class 1 vs. 2) can shift slopes and intercepts away from classic global values. The circles and diamonds represent fits for single-station and averaged events, respectively.
Other Images in This Article
Show More
Copyright and Terms & Conditions
© 2025. The Author(s). Published by the American Astronomical Society.