Image Details
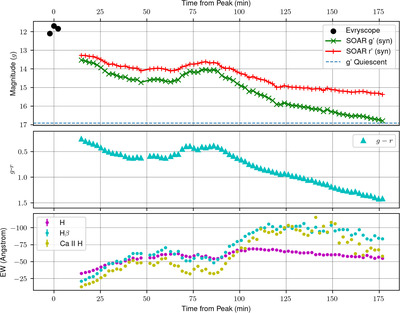
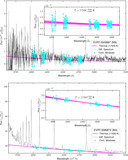
Caption: Figure 2.
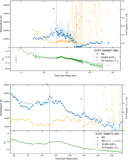
Top: light curves for EVRT-3586872 from Evryscope, ASAS-SN, and SOAR. SOAR light curves are integrated from flux-calibrated R ∼ 75 spectra, with a small zero-point offset. Middle: apparent g − r color evolution of the flare as a function of time. Bottom: equivalent width of the Ca II, Hβ, and Hα lines over the course of flare observations. The light-curve data, color evolution, and equivalent-width changes are available as data behind the figure.
(The data used to create this figure are available in the online article.)
(The data used to create this figure are available.)
Other Images in This Article
Show More
Copyright and Terms & Conditions
© 2025. The Author(s). Published by the American Astronomical Society.
Copyright ©
2026 Astronomy Image Explorer. All Rights Reserved.