Image Details
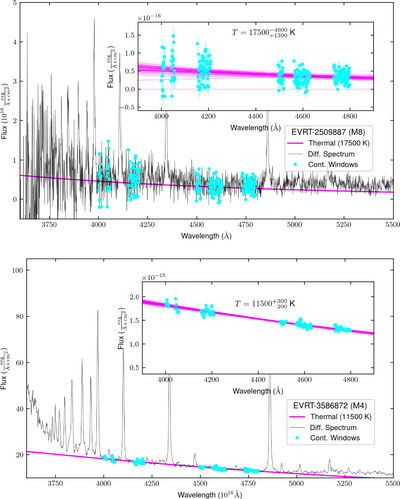
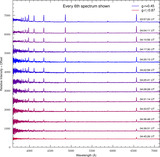
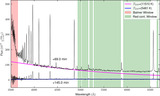
Caption: Figure 9.
Averaged differential spectra across a Gaussian time window centered on the secondary peak of the flares. The inset panels show the distribution of blackbody fits during the bootstrap procedure described in Section 1. The best-fit temperatures are ﹩17,50{0}_{-1300}^{+4600}﹩ K and ﹩11,50{0}_{-200}^{+300}﹩ K for EVRT-2509887 and EVRT-3586872, respectively. The continuum emission is poorly described by a single blackbody, and both deviate from a thermal spectrum at the end of the spectrum, due to Balmer continuum emission in the blue and “conundruum” in the red.
Other Images in This Article
Show More
Copyright and Terms & Conditions
© 2025. The Author(s). Published by the American Astronomical Society.
Copyright ©
2026 Astronomy Image Explorer. All Rights Reserved.