Image Details
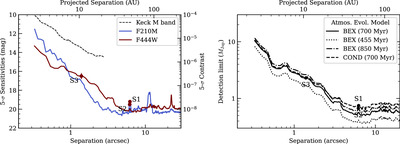
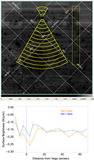
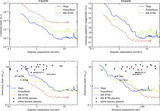
Caption: Figure 2.
Left: our detection limits are shown for each filter (F210M and F444W) as a function of separation from the parent star, in terms of contrast ratio (right-side axis) and apparent magnitude (left-side axis). The drop in detectability at ∼9″ corresponds to the boundary between subarray and full-frame imaging. The limits are given as 5σ. The pre-JWST contrast limit at M band from Keck (B. B. Ren et al. 2023) is shown as a dashed line for comparison; the JWST detections limits are a factor of ∼10 better within ∼2″, and improve even further at larger separations. Right: the flux sensitivities on the left are translated to 5σ detection limits in terms of planet mass. For a nominal system age of 700 Myr, two models of atmosphere evolution are considered—BEX-HELIOS (solid line; E. F. Linder et al. 2019) and Ames-COND (dashed line; I. Baraffe et al. 2003)—with similar results from both. A younger age (e.g., 450 Myr; J. Yoon et al. 2010) would correspond to planet masses lower by ∼30% (dotted line), while the upper limit from J. D. Monnier et al. (2012; 850 Myr) would result in slightly higher masses (dotted–dashed line).
Other Images in This Article
Show More
Copyright and Terms & Conditions
© 2024. The Author(s). Published by the American Astronomical Society.