Image Details
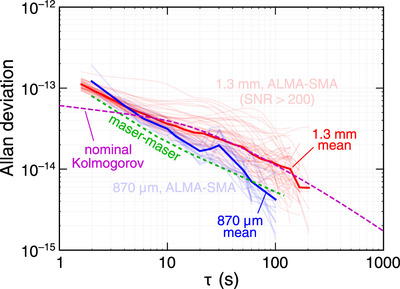
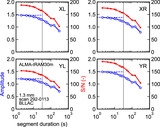
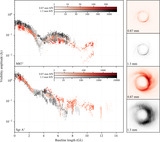
Caption: Figure 8.
Allan deviation for 870 μm (345 GHz) scans observed on the ALMA–SMA baseline (blue lines). For comparison, red lines show the Allan deviation for high-S/N scans (nominally 5 minutes long) during the 1.3 mm (230 GHz) 2017 EHT campaign (Event Horizon Telescope Collaboration et al. 2019b). Weather variability during the 2017 campaign is responsible for the spread in those scans. The means of the individual Allan deviation traces are shown in bold for the two frequencies. The 870 μm and 1.3 mm mean traces approach the nominal Allan deviation for a pair of T4 Science brand iMaser 3000 model masers (Thompson et al. 2017) at short timescales. At intermediate timescales, atmospheric turbulence can become important. The Allan deviation associated with Kolmogorov turbulence is plotted for a set of nominal parameters (Treuhaft & Lanyi 1987).
Other Images in This Article
Copyright and Terms & Conditions
© 2024. The Author(s). Published by the American Astronomical Society.