Image Details
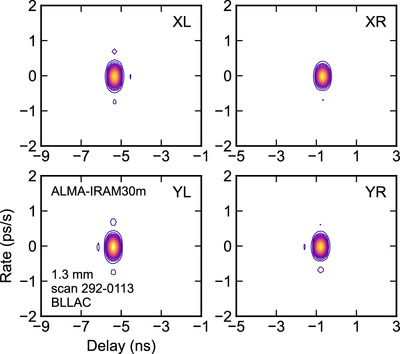
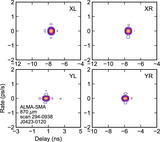
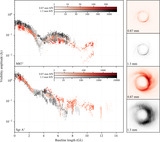
Caption: Figure 7.
1.3 mm contours of incoherently averaged fringe power in 5% increments vs. delay and rate for the baseline between ALMA and IRAM30m. This example is for a single scan on BL Lac taken on October 19, 01:13 UTC. Other detections reported in Table 2 also exhibit clear peaks vs. in delay-delay rate search space.
Other Images in This Article
Copyright and Terms & Conditions
© 2024. The Author(s). Published by the American Astronomical Society.
Copyright ©
2026 Astronomy Image Explorer. All Rights Reserved.