Image Details
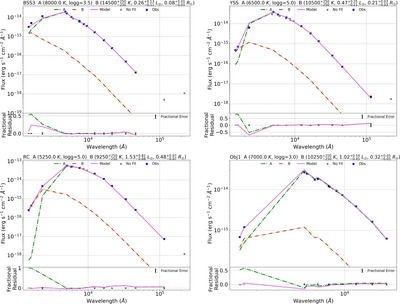
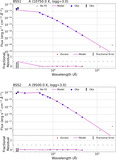
Caption: Figure 6.
The binary-component SEDs. In each upper panel, the blue data points indicate extinction-corrected flux values, with the black error bars representing flux errors. The green dashed line corresponds to the fit of the cool component, while the brown dashed line represents the fit for the hot components. Orange curves illustrate the iteration residuals. The composite fit is shown as a purple curve, and gray data points signify those not considered in the fits. VOSA does not consider these data points for fitting, due either to their bad photometry or to being the upper limits of the fluxes. Each bottom panel displays fractional residuals for single and composite fits. On the x-axis, black error bars denote fractional errors. The SED-derived parameters for the cool and hot components, along with their estimated errors, are shown at the top of the plots.
Other Images in This Article
Copyright and Terms & Conditions
© 2024. The Author(s). Published by the American Astronomical Society.