Image Details
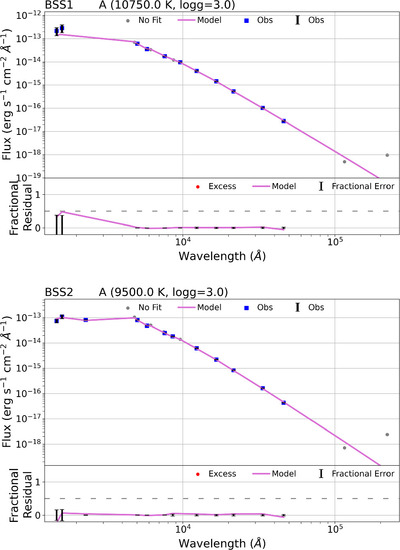
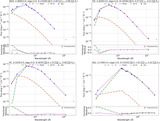
Caption: Figure 5.
The single-component SEDs. The upper panels show the extinction-corrected flux values, marked as blue squares, with the errors in fluxes shown as black bars. The purple curve represents the model fit. The data points that are not considered for fitting by VOSA are marked as gray dots. This is because these filters either have bad photometric data points or have upper limits of fluxes. The bottom panels show the residual between extinction-corrected observed fluxes and the model fluxes across the filters from UV to IR wavelengths.
Other Images in This Article
Copyright and Terms & Conditions
© 2024. The Author(s). Published by the American Astronomical Society.
Copyright ©
2026 Astronomy Image Explorer. All Rights Reserved.