Image Details
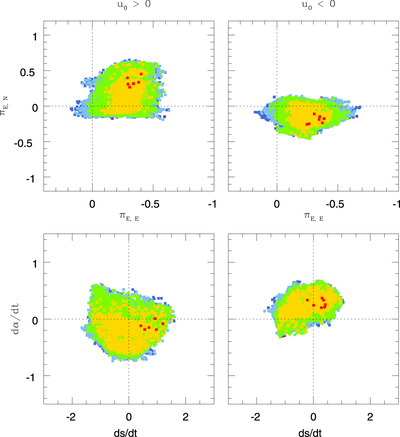
Caption: Figure 5.
χ 2 distributions of the best-fit parallax+orbital model with the partial data sets. The red, yellow, green, light blue, dark blue, and purple represent regions with Δχ 2 < (1, 4, 9, 16, 25, 36), from the best-fit model, respectively.
Other Images in This Article


Show More
Copyright and Terms & Conditions
© 2023. The Author(s). Published by the American Astronomical Society.
Copyright ©
2026 Astronomy Image Explorer. All Rights Reserved.