Image Details
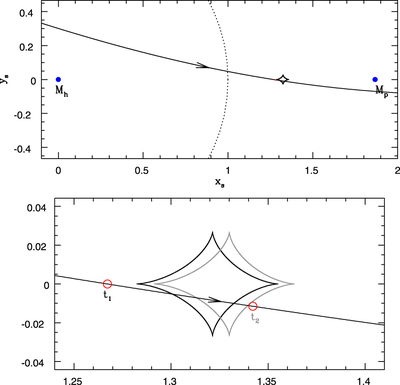
Caption: Figure 3.
Geometry of the best-fit parallax+orbital model. Top: the blue solid dots represent two lens components, while the red open circle represents the normalized source size. The dotted circle denotes the Einstein ring and the straight line with an arrow is the source trajectory. The black closed curve represents the planetary caustic. Bottom: close-up view of the planetary caustic region. The caustics at t 1 = 8741.2 and t 2 = 8743.5 are presented in black and gray, respectively.
Other Images in This Article


Show More
Copyright and Terms & Conditions
© 2023. The Author(s). Published by the American Astronomical Society.
Copyright ©
2026 Astronomy Image Explorer. All Rights Reserved.