Image Details
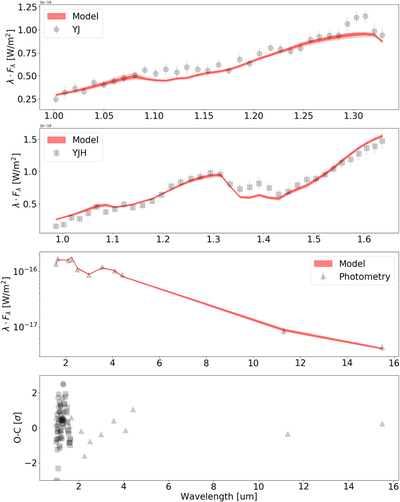
Caption: Figure 1.
Retrieved spectra for HIP 65426 b (assuming 1× solar metallcity and C/O = 0.4). Top three panels are the observed spectroscopic and photometric data (black) and the 1σ (16 to 84 percentile, darker red) and 2σ (2.5–97.5 percentile, lighter red) distribution of modeled spectra. The bottom panel is a residual plot with data minus model and divided by the individual errors. More results with other assumptions can be found in Table 4.
Other Images in This Article
Copyright and Terms & Conditions
© 2023. The Author(s). Published by the American Astronomical Society.
Copyright ©
2025 Astronomy Image Explorer. All Rights Reserved.