Image Details
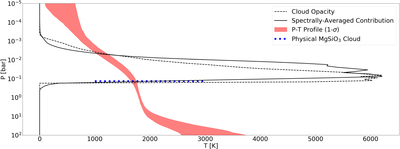
Caption: Figure 2.
Retrieved P-T profile (1σ region in red shaded region) for HIP 65426 b (assuming 1× solar metallcity and C/O = 0.4) The spectrally-averaged contribution function is shown as the black solid line, which completely overlaps with retrieved cloud layer (black dashed line). The pressure level of the retrieved cloud layer is consistent with that of a physical MgSiO3 cloud (blue dotted line). More results with other assumptions can be found in Table 4.
Other Images in This Article
Copyright and Terms & Conditions
© 2023. The Author(s). Published by the American Astronomical Society.
Copyright ©
2025 Astronomy Image Explorer. All Rights Reserved.