Image Details
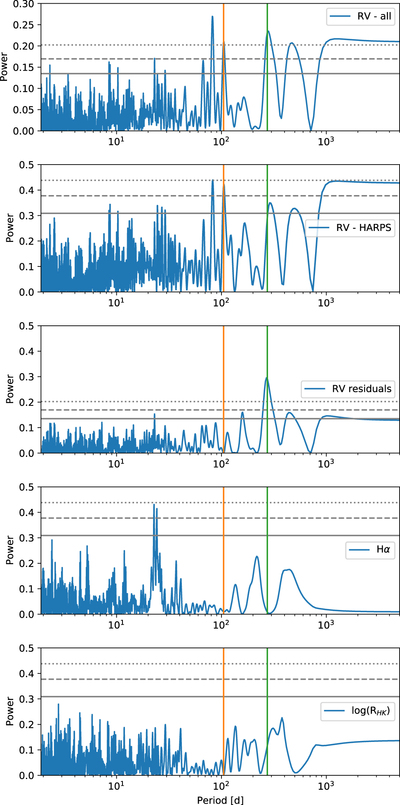
Caption: Figure 4.
Periodograms of the joint RVs (top panel); the HARPS RVs alone (second panel); the joint RV residuals to a one-planet fit for TOI-199 b (third panel); the HARPS Hα indicator (fourth panel); and the HARPS log(﹩{R}_{\mathrm{HK}}^{{\prime} }﹩) activity indicator (bottom panel). The gray solid, dashed, and dotted horizontal lines indicate false alarm probability levels of 10%, 1%, and 0.1%, respectively. The periods of the two planets are indicated with vertical orange and green lines. We note that the peak at ∼81 days is a one year alias of the ∼104 day planet.
Other Images in This Article

Show More
Copyright and Terms & Conditions
© 2023. The Author(s). Published by the American Astronomical Society.
Copyright ©
2026 Astronomy Image Explorer. All Rights Reserved.