Image Details
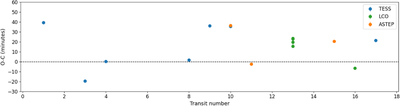
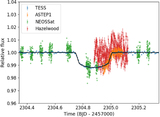
Caption: Figure 10.
O – C plot (difference between predicted and observed transit midpoint times) for the TESS, ASTEP, and LCO transits. The error bars are generally smaller than the marker size.
Other Images in This Article

Show More
Copyright and Terms & Conditions
© 2023. The Author(s). Published by the American Astronomical Society.
Copyright ©
2026 Astronomy Image Explorer. All Rights Reserved.