Image Details
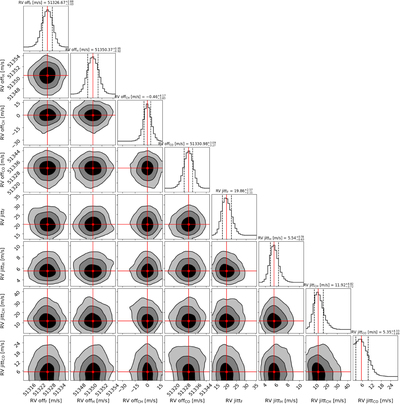
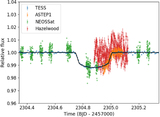
Caption: Figure C4.
Corner plot of the posterior distributions of the instrumental RV parameters for the joint modeling of the TESS and ASTEP TTVs, and the HARPS, FEROS, CHIRON, and CORALIE RVs. The distributions are explored using nested sampling. The red crosses indicate the median values, and the black contour lines the 1σ, 2σ, and 3σ confidence levels. Subindex H refers to HARPS, F to FEROS, CH to CHIRON, and CO to CORALIE.
Other Images in This Article

Show More
Copyright and Terms & Conditions
© 2023. The Author(s). Published by the American Astronomical Society.
Copyright ©
2026 Astronomy Image Explorer. All Rights Reserved.