Image Details
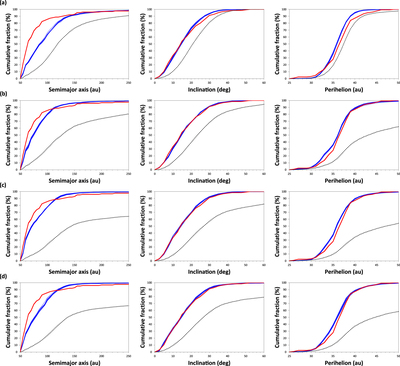
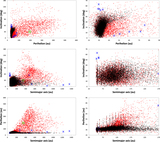
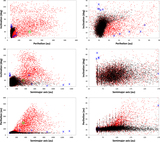
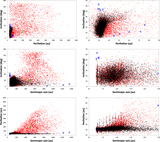
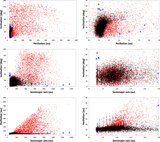
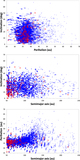
Caption: Figure 8.
Comparison of cumulative orbital distributions of detected objects from representative KBP models after biasing the results (blue curves) and OSSOS observations (red curves). Row (a) shows the results for the control model. Rows (b)–(d) show the results for the best KBP models #32, #49, and #59, respectively (Tables 3 and 4). These KBPs had the following properties: m = 1.5 M ⊕, a = 250 au (row (b)); m = 2 M ⊕, a = 350 au (row (c)); m = 3 M ⊕, a = 500 au (row (d)), and the same q = 195 au and i = 30°. The models’ intrinsic unbiased distributions are indicated by the dotted curves. Only detected objects with a > 50 au and q > 25 au were considered when evaluating the results reported in this figure.
Other Images in This Article
Copyright and Terms & Conditions
© 2023. The Author(s). Published by the American Astronomical Society.