Image Details
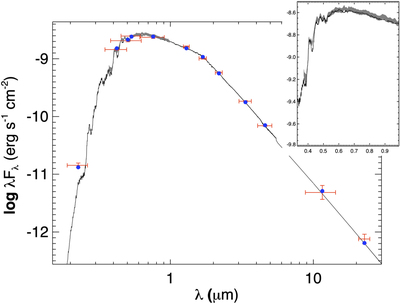
Caption: Figure 13.
SED of LTT 9779. Red symbols represent the observed photometric measurements, where the horizontal bars represent the effective width of the passband. Blue symbols are the model fluxes from the best-fit PHOENIX atmosphere model (black). The Gaia spectrum is also shown as a gray swathe; the inset plot shows a close up.
Other Images in This Article


Show More
Copyright and Terms & Conditions
© 2023. The Author(s). Published by the American Astronomical Society.
Copyright ©
2026 Astronomy Image Explorer. All Rights Reserved.