Image Details
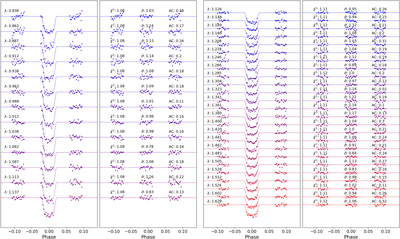
Caption: Figure 5.
Spectral light curves fitted with Iraclis for the G102 (left) and G141 (right) observations of LTT 9779 b where, for clarity, an offset has been applied. Each plot shows the detrended spectral light curves with the best-fit model plotted (left) as well as the residuals from the fitting (right). The values for the reduced chi-squared (﹩{\bar{\chi }}^{2}﹩), the standard deviation of the residuals with respect to the photon noise (﹩\bar{\sigma }﹩), and the autocorrelation (AC) function are also shown.
Other Images in This Article


Show More
Copyright and Terms & Conditions
© 2023. The Author(s). Published by the American Astronomical Society.
Copyright ©
2026 Astronomy Image Explorer. All Rights Reserved.