Image Details
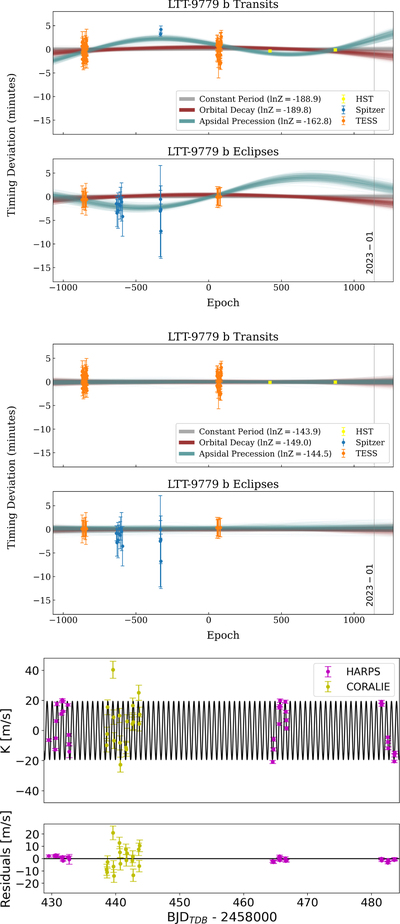
Caption: Figure 11.
Plots from our ephemeris fitting for LTT 9779 b. Top: observed minus calculated (O − C) plots for all transit and eclipse midtimes. The reference epoch is set to be halfway between the first and last transit used in this work. Traces from all three models, linear (gray), decay (red), and precession (turquoise), are also shown. Middle: O − C plots once the Spitzer transits have been discarded. In doing so, all evidence for nonlinear ephemerides is also removed. Bottom: fit to the literature radial velocity data. For brevity, we only show the best-fit model to this data when considering a constant period and when the Spitzer transit midtimes have been discarded, which we adopt as our favored model. However, these data are used in all our fits.
Other Images in This Article


Show More
Copyright and Terms & Conditions
© 2023. The Author(s). Published by the American Astronomical Society.