Image Details
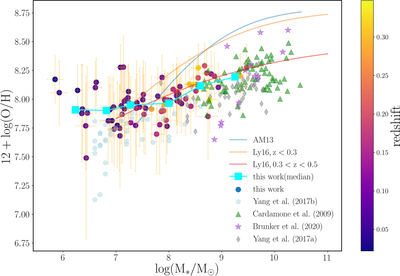
Caption: Figure 7.
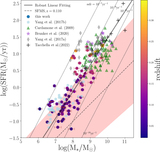
Mass–metallicity relation of our strong [O III]λ5007 compact galaxies (circles) color-coded by redshift. The orange error bars represent the measurement uncertainties. The other points are the same as those in Figure 6. The cyan squares display the median metallities in different mass bins. The blue solid curve is the MZR from Andrews & Martini (2013). The yellow and green solid curves are MZRs from Ly et al. (2016) in different redshift ranges.
Other Images in This Article
Copyright and Terms & Conditions
© 2023. The Author(s). Published by the American Astronomical Society.
Copyright ©
2025 Astronomy Image Explorer. All Rights Reserved.