Image Details
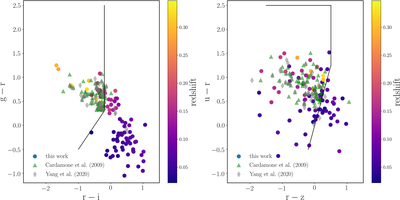
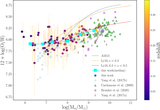
Caption: Figure 3.
Left: color–color diagram of r − i vs. g − r for our galaxy sample colored by redshift. Right: color–color diagram of r − z vs. u − r. Green-pea galaxies from Cardamone et al. (2009; green triangles) and Yang et al. (2017a; gray diamonds) are also overplotted. The solid lines mark the color selection criteria in Cardamone et al. (2009).
Other Images in This Article
Copyright and Terms & Conditions
© 2023. The Author(s). Published by the American Astronomical Society.
Copyright ©
2025 Astronomy Image Explorer. All Rights Reserved.