Image Details
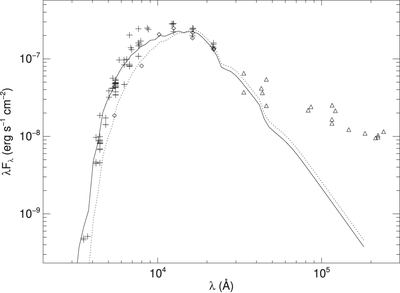
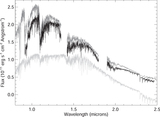
Caption: Figure 9.
The SED of RW Cep. The bright state fluxes are indicated by plus signs and triangles, and only the former were used for the fit of the model photospheric spectrum (solid line). The diamonds depict the estimated fluxes during the current faint state (see Table 2), and the dotted line shows the model photospheric fit for the faint state. See Figure 1 from Jones et al. (2023) for the longer wavelength part of the SED.
Other Images in This Article


Copyright and Terms & Conditions
© 2023. The Author(s). Published by the American Astronomical Society.
Copyright ©
2025 Astronomy Image Explorer. All Rights Reserved.