Image Details
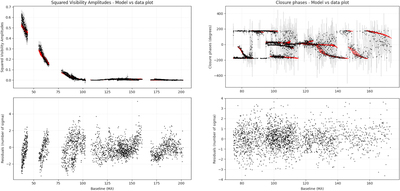
Caption: Figure 3.
The H-band visibilities (left) and CPs (right) for the telescope pair and triplet MIRC-X observations of RW Cep. The black symbols with vertical error bars are the measurements and the red dots represent the corresponding fits from the SQUEEZE reconstructed images. The lower panels show the residuals from the SQUEEZE fits. The fits from the OITOOLS and SURFING reconstructions yield residuals that are qualitatively similar in appearance.
Other Images in This Article


Copyright and Terms & Conditions
© 2023. The Author(s). Published by the American Astronomical Society.
Copyright ©
2025 Astronomy Image Explorer. All Rights Reserved.