Image Details
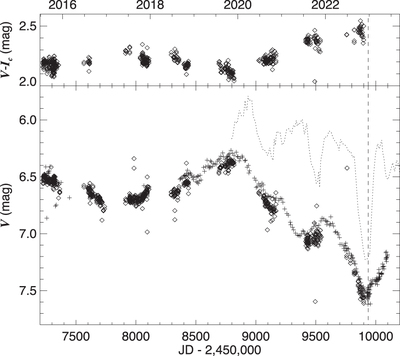
Caption: Figure 1.
The V-band light curve (lower panel) and V − I c color index (upper panel) of RW Cep over the past seven years. The lower panel shows the V-band light curve from the AAVSO archive (plus signs; mainly from observations made by W. Vollman) and the KWS (diamond symbols). The KWS includes estimates of the Johnson-Cousins I c -band magnitude, and the top panel shows the time evolution of the V − I c color index. The top axis gives the calendar date (BY) of the observation. The vertical dashed line indicates the date of the CHARA Array observation. For comparison purposes, the dotted line in the lower panel shows the Great Dimming of Betelgeuse from Taniguchi et al. (2022) for their 0.51 μm band photometry (seven point averages, offset by +1040 days in time and by +5.2 in magnitude).
Other Images in This Article


Copyright and Terms & Conditions
© 2023. The Author(s). Published by the American Astronomical Society.