Image Details
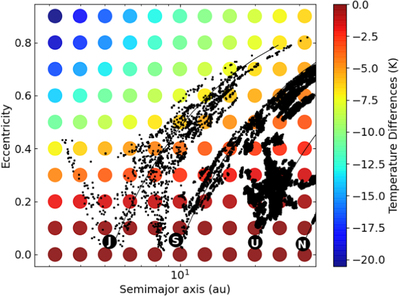
Caption: Figure 5.
A typical Jupiter-family comet trajectory taken from Gkotsinas et al. (2022) plotted over the temperature differences between elliptic orbits and an average of the effective thermal radius (r T ) inward and outward for all the a, e couples. Each circle represents a point in our orbital parameter space sampling. The color code gives the scale of the temperature difference.
Other Images in This Article


Copyright and Terms & Conditions
© 2023. The Author(s). Published by the American Astronomical Society.
Copyright ©
2026 Astronomy Image Explorer. All Rights Reserved.