Image Details
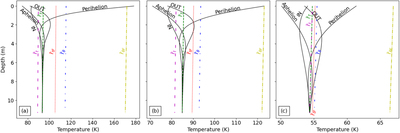
Caption: Figure 2.
Temperature profiles for a subsurface layer of 10 m, ∼1 Myr after the start of the simulations, for three a, e couples: (a) a = 7.94 au and e = 0.7, (b) a = 10.0 au and e = 0.5, and (c) a = 25.11 and e = 0.2. The solid black lines give the temperature profiles of elliptic orbits at perihelion, aphelion, and halfway through—time-wise—both inward and outward. The temperatures profiles for the equivalent orbits are true-anomaly-averaged radius (﹩{\bar{r}}_{\theta }﹩) (blue loosely dashed–dotted line), true-anomaly-averaged flux (﹩{\bar{r}}_{\theta F}﹩) (yellow dashed–dotted line), time-averaged radius (﹩{\bar{r}}_{t}﹩) (green dashed line), time-averaged flux (﹩{\bar{r}}_{{tF}}﹩) (red dotted line), and effective thermal radius (r T ) (purple loosely dashed line).
Other Images in This Article


Copyright and Terms & Conditions
© 2023. The Author(s). Published by the American Astronomical Society.