Image Details
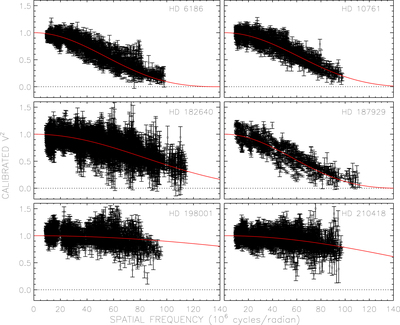
Caption: Figure 2.
Angular diameter fits to measured visibilities. The solid red line represents the visibility curve for the best-fit θ LD, the open circles are the calibrated visibilities, and the vertical lines are the measurement uncertainties.
Other Images in This Article
Copyright and Terms & Conditions
© 2023. The Author(s). Published by the American Astronomical Society.
Copyright ©
2026 Astronomy Image Explorer. All Rights Reserved.