Image Details
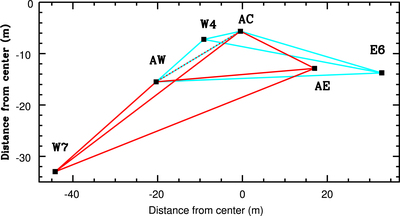
Caption: Figure 1.
The NPOI configuration used for six-way observing. The squares show the locations of the siderostats as a function of distance from the center, the red lines show the baselines on spectrograph 1, and the blue lines show the baselines on spectrograph 2. The dashed line is the baseline that repeats on both spectrographs. Table 3 lists the lengths of the various baselines.
Other Images in This Article
Copyright and Terms & Conditions
© 2023. The Author(s). Published by the American Astronomical Society.
Copyright ©
2026 Astronomy Image Explorer. All Rights Reserved.