Image Details
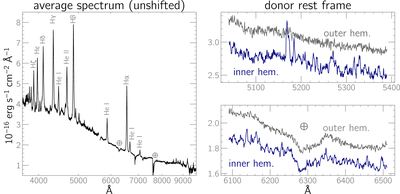
Caption: Figure 8.
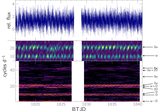
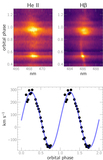
Left: average spectrum of Paloma, without any velocity shift applied. Telluric features have not been removed. Right panels: segments of the average spectra in the donor star’s rest frame, showing a forest of weak metal emission lines from the inner hemisphere. The velocity-corrected spectra are based on the measured semiamplitudes of 220 and 310 km s−1 for the secondary’s inner and outer hemispheres, respectively.
Other Images in This Article
Copyright and Terms & Conditions
© 2023. The Author(s). Published by the American Astronomical Society.
Copyright ©
2026 Astronomy Image Explorer. All Rights Reserved.