Image Details
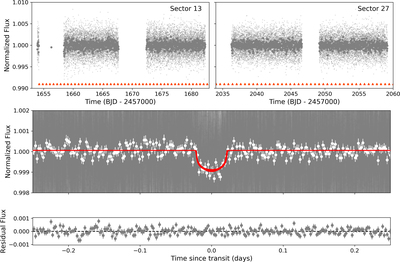
Caption: Figure 4.
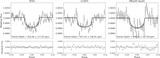
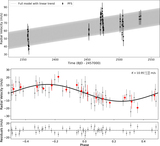
TESS light curves of TOI-1075. Top: detrended, normalized, and flattened PDCSAP flux measurements for Sector 13 (left) and Sector 27 (right). Lighter gray points are the TESS 2 minute cadence flux measurements; darker points are the same data binned into 30 minute intervals. The transits of TOI-1075 b are marked by orange triangles. Middle: phase-folded light curve on the planet’s orbital period (0.605 day), along with the best-fit transit model (red). Gray points are 2 minute cadence measurements; white points are the same data binned into 5 minute intervals. Bottom: residuals after the data have been subtracted from the best-fit model.
Other Images in This Article
Copyright and Terms & Conditions
© 2023. The Author(s). Published by the American Astronomical Society.