Image Details
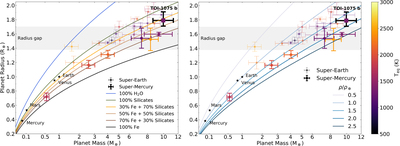
Caption: Figure 8.
Mass–radius diagram for small planets (R p < 2 R ⊕ and M p < 10 M ⊕) with measured mass and radius uncertainties below 30%, as listed in the NASA Exoplanet Archive (only planet masses measured by the RV method are considered). Planets are colored according to their calculated equilibrium temperature (assuming zero albedo and efficient heat redistribution). Super-Earth planets are shown with squares, and super-Mercury planets are shown with diamonds. The gray shaded region denotes the radius gap for low-mass stars centered at 1.54 ± 0.16 R ⊕ (Cloutier & Menou 2020). The terrestrial solar system planets are plotted for reference. Left: mass–radius diagram with curves of constant composition. The solid lines are theoretical internal composition curves (Zeng et al. 2021; Lin et al. 2022, in preparation). From top to bottom: 100% H2O (blue), 100% silicates (green), a mixture of 30% Fe and 70% silicates by mass (orange), a mixture of 50% Fe and 50% silicates by mass (light brown), a mixture of 70% Fe and 30% silicates by mass (dark brown), and 100% Fe (black). The bulk density of TOI-1075 b is consistent with a 35% Fe + 65% silicates by mass composition. Right: mass–radius diagram with curves of constant density relative to Earth. The density of TOI-1075 b is ∼1.75 times greater than the Earth.
Other Images in This Article
Copyright and Terms & Conditions
© 2023. The Author(s). Published by the American Astronomical Society.