Image Details
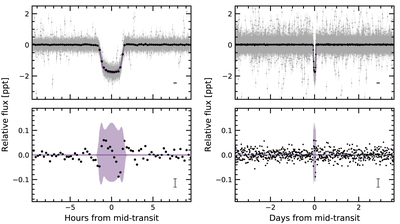
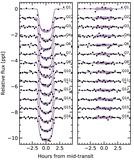
Caption: Figure 6.
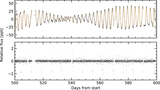
Phase-folded transit of Kepler 1627Ab with stellar variability removed. Windows over 20 hr (left) and the entire orbit (right) are shown, and the residual after subtracting the transit is in the bottom row. The 2σ model uncertainties and the best-fit model are the light purple band and the dark purple line. Gray points are individual flux measurements; black points bin these into 15 minute intervals and have a representative 1σ error bar in the lower right of each panel. The asymmetric residual during transit is larger than the out-of-transit scatter.
Other Images in This Article
Show More
Copyright and Terms & Conditions
© 2022. The Author(s). Published by the American Astronomical Society.
Copyright ©
2025 Astronomy Image Explorer. All Rights Reserved.