Image Details

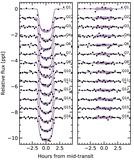
Caption: Figure 8.
Keck/HIRES radial velocities and MuSCAT3 photometry from the transit of 2021 Aug 7. Top: the radial velocity jitter across the 15 minute exposures (σ RV ≈ 30 m s−1) prevented us from detecting the RM effect; a model including the RM anomaly and a quadratic trend in time to fit the spot-induced ≈250 m s−1 trend is shown (see Appendix C). Shaded bands show 2σ model uncertainties. Middle: the RV variations are strongly correlated with varying emission in the Ca H and K lines. Bottom: the photometric transit depths are consistent across the griz bandpasses. The photometry is binned at 10 minute intervals.
Other Images in This Article
Show More
Copyright and Terms & Conditions
© 2022. The Author(s). Published by the American Astronomical Society.