Image Details
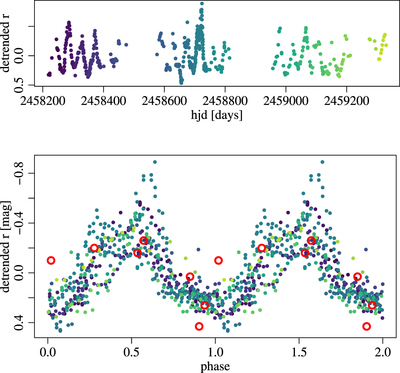
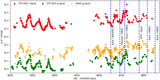
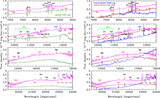
Caption: Figure 8.
Top: ZTF r-band light curve with linear detrending performed separately for the 2018, 2019, and 2020 seasons. Color scale shows a progression of hues from earlier to later cycles. Bottom: phased light curve for a period of 43.4 days, repeated twice so as to more readily discern the full-phase shape. Larger red points are the seven data points from Magakian et al. (2019).
Other Images in This Article
Show More
Copyright and Terms & Conditions
© 2022. The Author(s). Published by the American Astronomical Society.
Copyright ©
2026 Astronomy Image Explorer. All Rights Reserved.