Image Details
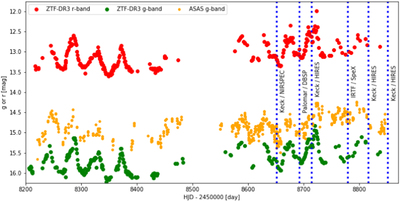
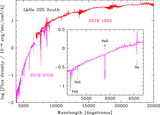
Caption: Figure 4.
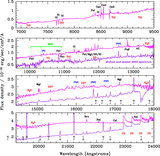
LkHα 225 South time series obtained in the r band and g band by the ZTF in the 2018 and 2019 seasons; error bars are plotted but are generally smaller than the points. The source is clearly quasiperiodic in the outburst state, with an oscillation timescale of a little more than a month. The g-band photometry reported by ASAS is also included. The ∼1 mag offset between the ASAS and ZTF g-band measurements is likely a result of the large ASAS pixels; added variability from LkHα 225 North on top of the quasiperiodic variations exhibited by LkHα 225 South perhaps explains the inconsistencies, e.g., around MJD ≈ 8350 and 8390 days. Epochs of spectroscopy are indicated and labeled.
Other Images in This Article
Show More
Copyright and Terms & Conditions
© 2022. The Author(s). Published by the American Astronomical Society.