Image Details
Caption: Figure 1.
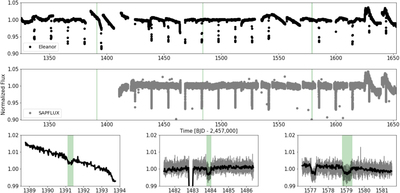
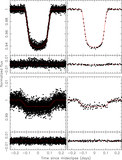
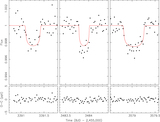
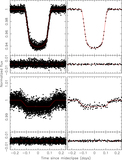
Upper panel: Sectors 1–12 of 30 minute cadence TESS eleanor PSF-extracted light curve (black). Some of the eclipses were missed due to data gaps. The CBP transits are highlighted in green. Middle panel: Sectors 4–12 of 2 minute cadence SAPFLUX light curve (gray). Lower panels: 5 day sections of the light curve centered on the three CBP transits (highlighted in green). The lower middle and lower right panels also show the primary and secondary eclipses near days 1483 and 1577, respectively.
Other Images in This Article
Show More
Copyright and Terms & Conditions
© 2020. The American Astronomical Society. All rights reserved.
Copyright ©
2026 Astronomy Image Explorer. All Rights Reserved.