Image Details
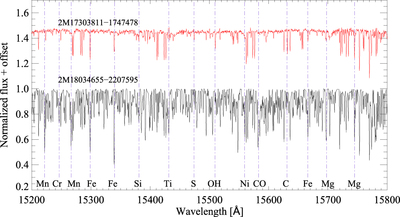
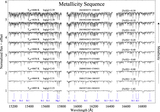
Caption: Figure 9.
Comparison of a section of the APOGEE spectra for two stars of the same temperature (approximately 4060 K) with about a 100× ratio in the abundance of iron. The red (top) spectrum is for a star that has [Fe/H] = −1.68 and ﹩\mathrm{log}g=0.40﹩. The black (bottom) spectrum is for a star that has [Fe/H] = +0.28 and ﹩\mathrm{log}g=1.39﹩ (DR12 values).
Other Images in This Article


Show More
Copyright and Terms & Conditions
© 2017. The American Astronomical Society. All rights reserved.
Copyright ©
2026 Astronomy Image Explorer. All Rights Reserved.