Image Details
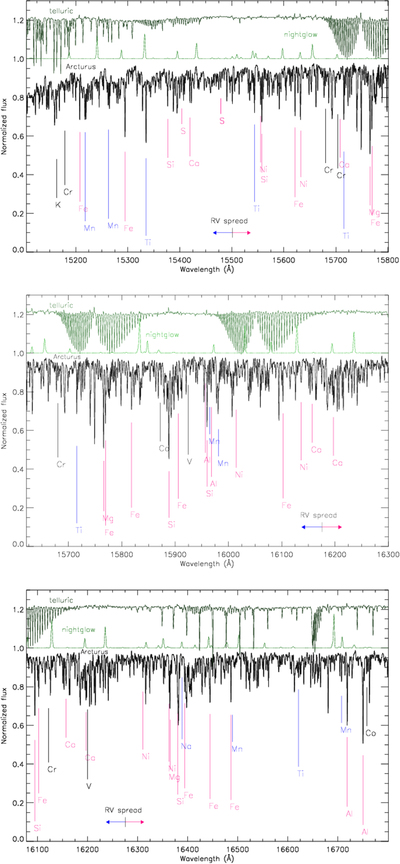
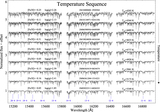
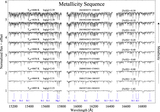
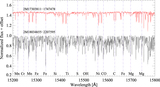
Caption: Figure 2.
In three overlapping wavelength regions, the distribution of telluric absorption (top spectrum in each panel), airglow (middle spectra), and the spectrum of the star Arcturus (bottom spectra). Some prominent atomic lines in the Arcturus spectrum that guided the ultimate selection of the APOGEE wavelength region are identified and color-coded as high priority (red), medium priority (blue), and lower priority (black). Also indicated are the extremes in the potential shift in the lines from extremes in radial velocity variation for potential (e.g., halo) Milky Way stars (adopted as ±700 km s−1 in the lines).
Other Images in This Article


Show More
Copyright and Terms & Conditions
© 2017. The American Astronomical Society. All rights reserved.