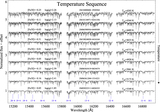
Image Details
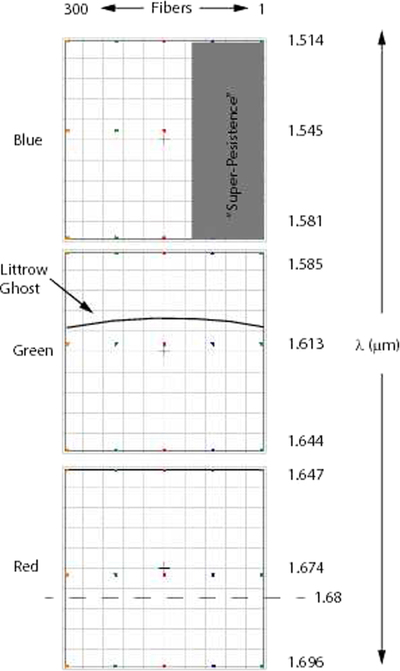
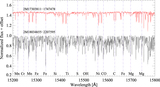
Caption: Figure 5.
Schematic figure showing the arrangement of fibers and wavelengths across the three APOGEE detectors. The wavelengths indicate the edges of the arrays as well as fiducial wavelength positions (indicated by gray dots) corresponding to the “mid-chip” properties given in Table 2. The locations of the Littrow ghost (curved line) and the super-persistent region (gray area) are also indicated. The dashed line at 1.68 μm shows the red limit of the wavelength coverage for which the technical performance of the instrument was specified by the science requirements, but the instrument performance is still good redward of this.
Other Images in This Article


Show More
Copyright and Terms & Conditions
© 2017. The American Astronomical Society. All rights reserved.