

Image Details
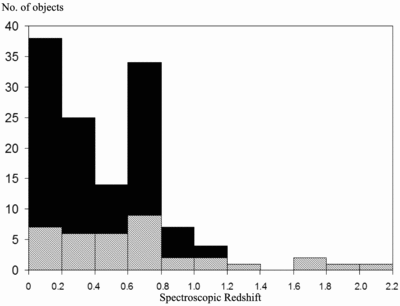
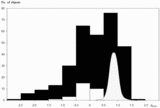
Caption: Fig. 6.
Histogram of spectroscopic redshifts for our sample. The upper curve (black area) shows the total for all objects, while the lower curve (hatched area) shows objects classified as AGNs.
Other Images in This Article

Copyright and Terms & Conditions
© 2006. The American Astronomical Society. All rights reserved. Printed in U.S.A.

Copyright ©
2026 Astronomy Image Explorer. All Rights Reserved.
