

Image Details
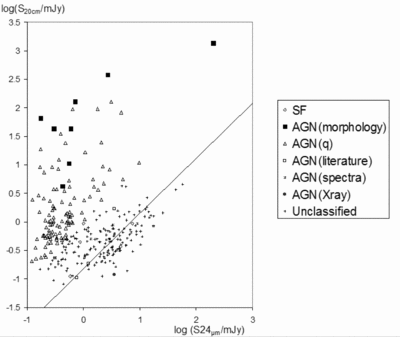
Caption: Fig. 4.
Observed 20 cm integrated flux plotted against SWIRE 24 μm flux for those sources in our sample that were also detected at 24 μm, classified according to the criteria discussed in § 3.4. The diagonal line shows the radio‐FIR correlation ﹩q_{24\,\mu \mathrm{m}\,}=\mathrm{log}\,( S_{24\,\mu \mathrm{m}\,}/ S_{20\,\mathrm{cm}\,}) =0.84﹩ suggested by the Appleton et al. data (2004).
Other Images in This Article

Copyright and Terms & Conditions
© 2006. The American Astronomical Society. All rights reserved. Printed in U.S.A.

Copyright ©
2026 Astronomy Image Explorer. All Rights Reserved.
