

Image Details
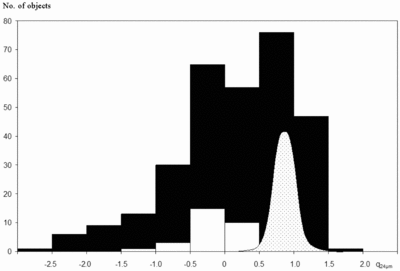
Caption: Fig. 5.
Distribution of values of ﹩q_{24\,\mu \mathrm{m}\,}=\mathrm{log}\,( S_{24\,\mu \mathrm{m}\,}/ S_{20\,\mathrm{cm}\,}) ﹩. The black histogram represents the subsample of ATLAS sources for which 24 μm fluxes are available. The white histogram represents the upper limits derived by Higdon et al. (2005) for their sample of optically invisible radio sources, which are believed to be obscured AGNs. The Gaussian curve shows the approximate distribution of the sample of Appleton et al. (2004), which is dominated by star‐forming galaxies.
Other Images in This Article

Copyright and Terms & Conditions
© 2006. The American Astronomical Society. All rights reserved. Printed in U.S.A.

Copyright ©
2026 Astronomy Image Explorer. All Rights Reserved.
