Image Details
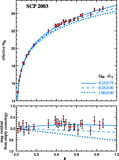
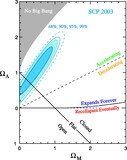
Caption: Fig. 9.
Plot of 68.3%, 95.4%, and 99.7% confidence regions for ΩM and ΩΛ using different data subsets and methods for treating host galaxy extinction corrections. The top row represents our fits to the low‐extinction primary subset, where significantly reddened SNe have been omitted and host galaxy extinction corrections are not applied. The second row shows fits where extinction corrections have been applied using a one‐sided extinction prior. These fits are sensitive to the choice of prior and can either yield results equivalent to analyses assuming low extinction (but without testing the assumption) or yield biased results (see text). Note that the published contours from Riess et al. (1998, their Fig. 6; solid contours) presented results from fits that included nine well‐observed SNe (that are comparable to the primary subsets used in the other panels), but also four SNe with very sparsely sampled light curves, one SN at ﹩z=0.97﹩ without a spectral confirmation, as well as two SNe from the P99 set. The third row shows fits with unbiased extinction corrections applied to our primary subset. The HST SNe presented in this paper show a marked improvement in the precision of the color measurements and hence in the precision of the ΩM and ΩΛ measurements when a full extinction correction is applied. With full and unbiased extinction corrections, dark energy is still required with ﹩P( \Omega _{\Lambda }> 0) =0.99﹩.
Other Images in This Article
Show More
Copyright and Terms & Conditions
© 2003. The American Astronomical Society. All rights reserved. Printed in U.S.A.