Image Details
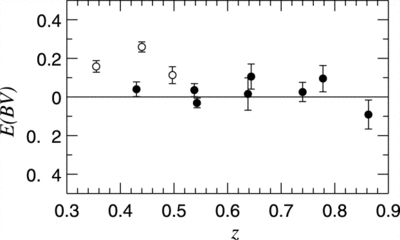
Caption: Fig. 3.
Plot of E(B−V) as a function of redshift for the 11 HST‐observed SNe of this paper, showing that the blue edge of the distribution shows no significant evolution with redshift. (The larger dispersion at lower redshifts is expected for a flux‐limited sample.) Error bars include only measurement errors and no assumed intrinsic color dispersion. Filled circles are those SNe in the low‐extinction subset (subset 2).
Other Images in This Article
Show More
Copyright and Terms & Conditions
© 2003. The American Astronomical Society. All rights reserved. Printed in U.S.A.
Copyright ©
2026 Astronomy Image Explorer. All Rights Reserved.