Image Details

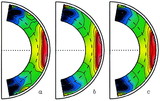
Caption: Fig. 9.
Longitudinally averaged angular velocity profiles: (a) the solar rotation according to an RLS inversion of p‐mode frequency splittings from the first six months of GONG data (Thompson et al. 1996); (b)–(d) the rotation in simulation TUR; (b) at one time step; (c) averaged over one rotation period; and (d) averaged over 10 rotation periods. The color tables and contour levels used for the helioseismic and simulation data are indicated. Note that the computational domain does not extend all the way to the photosphere, as discussed in § 3.
Copyright and Terms & Conditions
© 2000. The American Astronomical Society. All rights reserved. Printed in U.S.A.


