Image Details
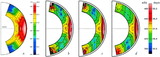
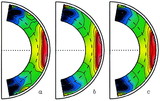
Caption: Fig. 2.
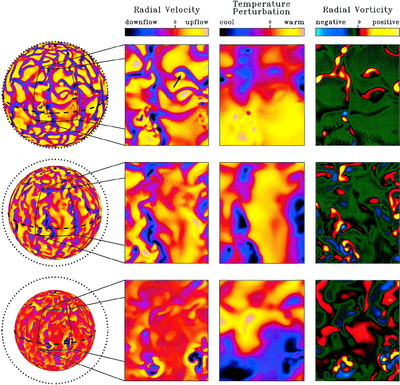
The left column shows instantaneous snapshots of the radial velocity on horizontal surfaces located in the upper convection zone (top), near the middle of the convection zone (middle), and in the overshoot region (bottom). In each image, the location of the outer boundary is indicated by a dotted line and the equator by a dashed line. The north pole in each surface, indicated by a black dot, is tilted 20° out of the paper. A blow‐up of a ﹩50^{\circ }\times 60^{\circ }﹩ segment in latitude and longitude is also shown at each level, as indicated by the solid lines. The arrow in the upper image highlights a vortical velocity feature discussed in the text. In the middle and right columns, the corresponding temperature perturbation and radial vorticity field are displayed. The color tables used for each of the three quantities are indicated, but the scaling varies with depth. In the northern hemisphere, positive and negative radial vorticity correspond to cyclonic and anticyclonic motions, respectively (vice versa in the southern hemisphere).
Other Images in This Article
Show More
Copyright and Terms & Conditions
© 2000. The American Astronomical Society. All rights reserved. Printed in U.S.A.