Image Details
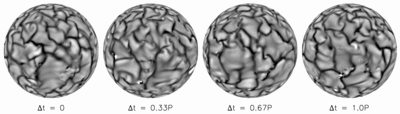
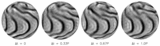
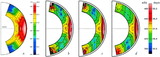
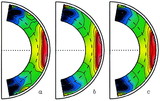
Caption: Fig. 5.
Snapshots of the radial velocity field in simulation TUR are shown at a level near the top of the convection zone (﹩r=0.95\,R_{\odot }﹩). The time interval between each successive image is about 9 days, one‐third the rotation period of the coordinate system, P (= 28 days). Each surface is tilted 20°, such that the north pole points out of the plane of the page, as in Figs. 2 and 3. Light and dark regions denote upflow and downflow, respectively.
Other Images in This Article
Show More
Copyright and Terms & Conditions
© 2000. The American Astronomical Society. All rights reserved. Printed in U.S.A.
Copyright ©
2025 Astronomy Image Explorer. All Rights Reserved.