Image Details
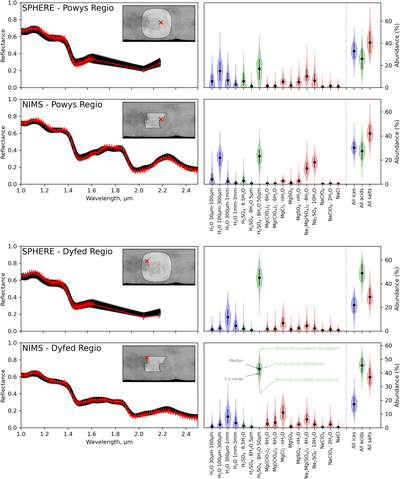
Caption: Figure 9.
Fit result for spectra from Powys Regio and Dyfed Regio. The left column shows the observed spectrum (red) and the “family” of MCMC fitted spectra (black). The right column shows the violin plots for the fitted posterior abundance distributions, where the shaded region shows the full posterior distribution of abundance values. The horizontal width of the shaded region shows the shape of the posterior distribution (where wider areas are more likely and narrower areas are less likely), and the vertical height of the shaded region shows the full range of simulated abundance values. The black dot shows the median best-estimate abundance, and the black line gives the 1σ uncertainty around this estimate. Numerical values are provided in the Appendix.
Other Images in This Article


Show More
Copyright and Terms & Conditions
© 2022. The Author(s). Published by the American Astronomical Society.